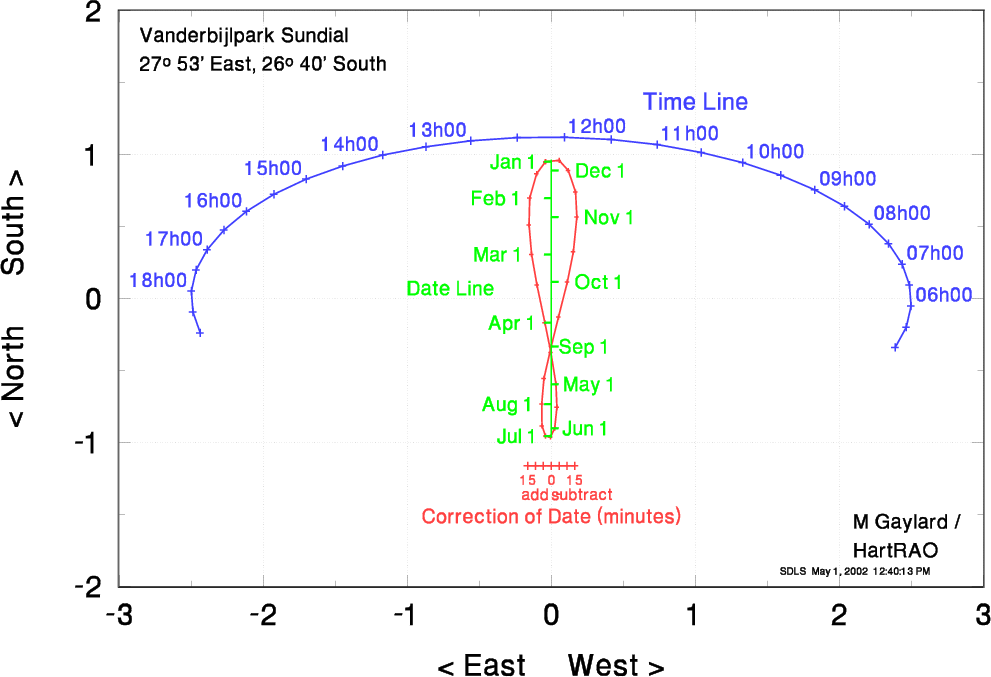

Note that the "squares" on the diagram must look square, ie one unit of length horizontally must equal one unit of length vertically.
The data used to create this sundial are listed below, if you want to make your own large "walk-on" sundial. The columns are:
       Sasolburg, Vanderbijlpark, Vereeniging Area

        Time       Xtime       Ytime        date         Xan         Yan        Teqn       XTeqn
       05h00       2.389      -0.341       Jan01      -0.040       0.951      -15.00      -0.164
       05h30       2.465      -0.198       Jan15      -0.101       0.868      -10.00      -0.109
       06h00       2.498      -0.052       Feb01      -0.149       0.697       -5.00      -0.055
       06h30       2.489       0.095       Feb15      -0.154       0.512        0.00       0.000
       07h00       2.437       0.240       Mar01      -0.135       0.307        5.00       0.055
       07h30       2.343       0.381       Mar15      -0.099       0.094       10.00       0.109
       08h00       2.210       0.515       Apr01      -0.044      -0.168       15.00       0.164
       08h30       2.038       0.641       Apr15      -0.001      -0.375
       09h00       1.832       0.756       May01       0.033      -0.594
       09h30       1.594       0.857       May15       0.040      -0.756
       10h00       1.329       0.945       Jun01       0.025      -0.901
       10h30       1.041       1.016       Jun15      -0.004      -0.961
       11h00       0.736       1.069       Jul01      -0.039      -0.955
       11h30       0.418       1.104       Jul15      -0.065      -0.886
       12h00       0.092       1.121       Aug01      -0.067      -0.733
       12h30      -0.235       1.118       Aug15      -0.050      -0.555
       13h00      -0.557       1.096       Sep01       0.000      -0.334
       13h30      -0.871       1.055       Sep15       0.051      -0.128
       14h00      -1.169       0.997       Oct01       0.112       0.115
       14h30      -1.448       0.921       Oct15       0.154       0.325
       15h00      -1.701       0.829       Nov01       0.179       0.567
       15h30      -1.926       0.724       Nov15       0.169       0.739
       16h00      -2.117       0.606       Dec01       0.119       0.890
       16h30      -2.273       0.477       Dec15       0.055       0.959
       17h00      -2.389       0.341                  -0.040       0.951
       17h30      -2.465       0.198
       18h00      -2.498       0.052
       18h30      -2.489      -0.095
       19h00      -2.437      -0.240