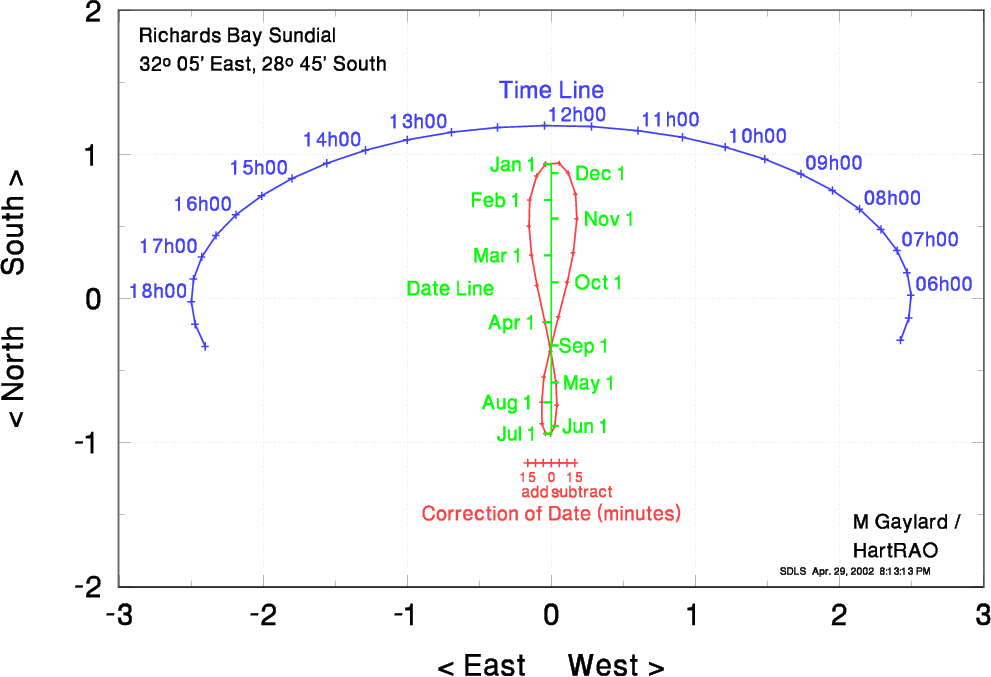
Note that the "squares" on the diagram must look square, ie one unit of length horizontally must equal one unit of length vertically.
The data used to create this sundial are listed below, if you want to make your own large "walk-on" sundial. The columns are:
	Richards Bay
        Time       Xtime       Ytime        date         Xan         Yan        Teqn       XTeqn
       05h00       2.427      -0.289       Jan01      -0.040       0.933      -15.00      -0.164
       05h30       2.484      -0.134       Jan15      -0.101       0.852      -10.00      -0.109
       06h00       2.500       0.023       Feb01      -0.149       0.684       -5.00      -0.055
       06h30       2.472       0.179       Feb15      -0.154       0.502        0.00       0.000
       07h00       2.402       0.333       Mar01      -0.135       0.301        5.00       0.055
       07h30       2.291       0.481       Mar15      -0.099       0.092       10.00       0.109
       08h00       2.141       0.621       Apr01      -0.044      -0.165       15.00       0.164
       08h30       1.954       0.750       Apr15      -0.001      -0.368
       09h00       1.734       0.866       May01       0.033      -0.583
       09h30       1.484       0.968       May15       0.040      -0.742
       10h00       1.209       1.053       Jun01       0.025      -0.884
       10h30       0.913       1.119       Jun15      -0.004      -0.943
       11h00       0.601       1.167       Jul01      -0.039      -0.937
       11h30       0.279       1.195       Jul15      -0.065      -0.869
       12h00      -0.047       1.202       Aug01      -0.067      -0.719
       12h30      -0.373       1.189       Aug15      -0.050      -0.544
       13h00      -0.693       1.155       Sep01       0.000      -0.328
       13h30      -1.000       1.102       Sep15       0.051      -0.126
       14h00      -1.291       1.030       Oct01       0.112       0.113
       14h30      -1.559       0.940       Oct15       0.154       0.318
       15h00      -1.801       0.834       Nov01       0.179       0.556
       15h30      -2.012       0.714       Nov15       0.169       0.725
       16h00      -2.188       0.581       Dec01       0.119       0.873
       16h30      -2.327       0.439       Dec15       0.055       0.941
       17h00      -2.427       0.289                  -0.040       0.933
       17h30      -2.484       0.134
       18h00      -2.500      -0.023
       18h30      -2.472      -0.179
       19h00      -2.402      -0.333