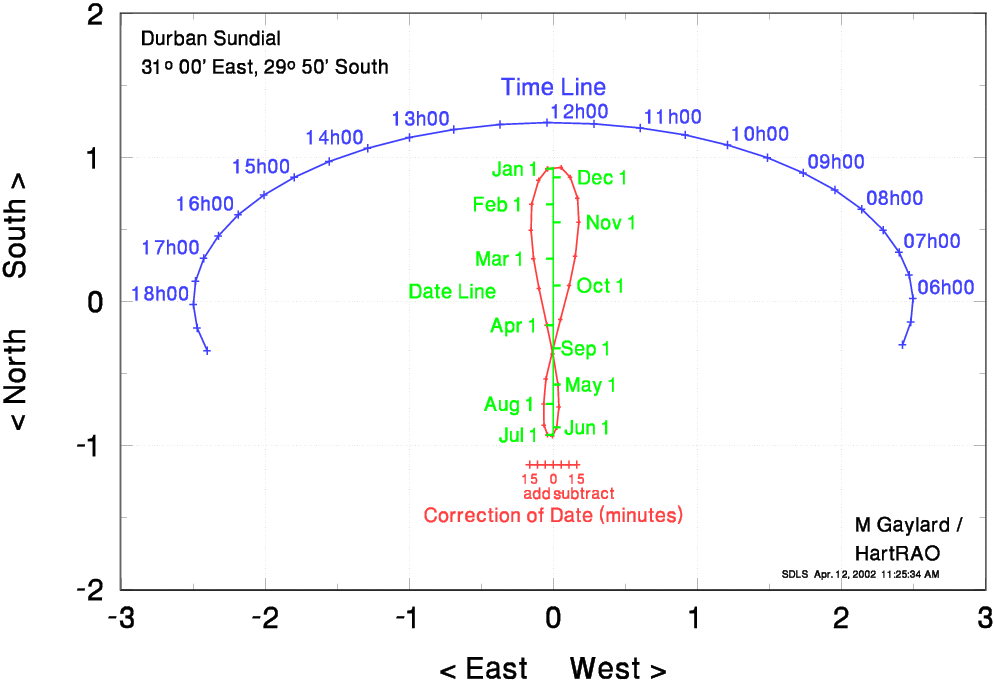
Sundial for Durban

large Durban sundial

Note that the "squares" on the diagram must look square, ie one unit of length horizontally must equal one unit of length vertically.

The data used to create this sundial are listed below, if you want to make your own large "walk-on" sundial. The columns are:

The units for the X and Y distances are metres for a walk-on sundial.
Note that the time- and datelines should be drawn as smooth curves.

       Durban
        Time       Xtime       Ytime        date         Xan         Yan        Teqn       XTeqn
       05h00       2.426      -0.301       Jan01      -0.040       0.924      -15.00      -0.164
       05h30       2.484      -0.141       Jan15      -0.101       0.843      -10.00      -0.109
       06h00       2.500       0.022       Feb01      -0.149       0.677       -5.00      -0.055
       06h30       2.473       0.184       Feb15      -0.154       0.497        0.00       0.000
       07h00       2.403       0.343       Mar01      -0.135       0.298        5.00       0.055
       07h30       2.293       0.496       Mar15      -0.099       0.091       10.00       0.109
       08h00       2.143       0.641       Apr01      -0.044      -0.163       15.00       0.164
       08h30       1.957       0.774       Apr15      -0.001      -0.364                        
       09h00       1.737       0.895       May01       0.033      -0.577                        
       09h30       1.487       1.000       May15       0.040      -0.734                        
       10h00       1.212       1.088       Jun01       0.025      -0.875                        
       10h30       0.916       1.157       Jun15      -0.004      -0.933                        
       11h00       0.605       1.207       Jul01      -0.039      -0.927                        
       11h30       0.283       1.236       Jul15      -0.065      -0.860                        
       12h00      -0.044       1.243       Aug01      -0.067      -0.712                        
       12h30      -0.370       1.230       Aug15      -0.050      -0.538                        
       13h00      -0.689       1.196       Sep01       0.000      -0.324                        
       13h30      -0.997       1.141       Sep15       0.051      -0.124                        
       14h00      -1.288       1.066       Oct01       0.112       0.112                        
       14h30      -1.556       0.973       Oct15       0.154       0.315                        
       15h00      -1.798       0.864       Nov01       0.179       0.550                        
       15h30      -2.010       0.740       Nov15       0.169       0.718                        
       16h00      -2.187       0.603       Dec01       0.119       0.864                        
       16h30      -2.326       0.456       Dec15       0.055       0.931                        
       17h00      -2.426       0.301                  -0.040       0.924                        
       17h30      -2.484       0.141                                                            
       18h00      -2.500      -0.022                                                            
       18h30      -2.473      -0.184                                                            
       19h00      -2.403      -0.343                                                            


since 2002/04/12
www.hartrao.ac.za/other/sundial/sdldrb.html
Last updated 2002/04/12 by M Gaylard