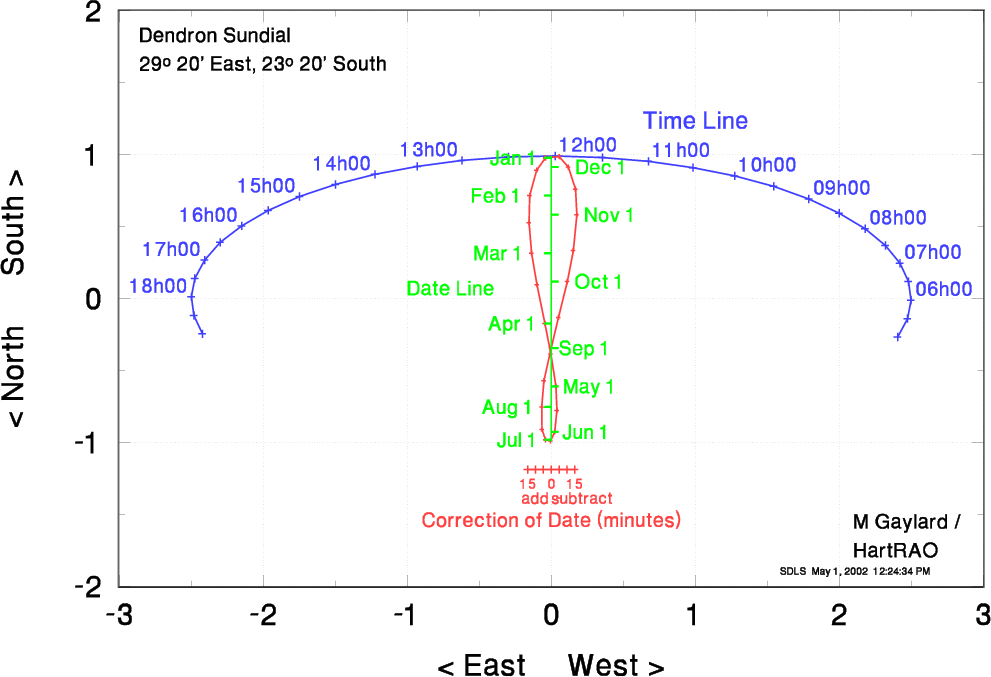

Note that the "squares" on the diagram must look square, ie one unit of length horizontally must equal one unit of length vertically.
The data used to create this sundial are listed below, if you want to make your own large "walk-on" sundial. The columns are:
       Dendron Area

        Time       Xtime       Ytime        date         Xan         Yan        Teqn       XTeqn
       05h00       2.407      -0.267       Jan01      -0.040       0.978      -15.00      -0.164
       05h30       2.475      -0.141       Jan15      -0.101       0.892      -10.00      -0.109
       06h00       2.500      -0.012       Feb01      -0.149       0.716       -5.00      -0.055
       06h30       2.482       0.118       Feb15      -0.154       0.526        0.00       0.000
       07h00       2.422       0.245       Mar01      -0.135       0.315        5.00       0.055
       07h30       2.321       0.368       Mar15      -0.099       0.096       10.00       0.109
       08h00       2.180       0.485       Apr01      -0.044      -0.173       15.00       0.164
       08h30       2.001       0.594       Apr15      -0.001      -0.385
       09h00       1.788       0.692       May01       0.033      -0.611
       09h30       1.545       0.778       May15       0.040      -0.777
       10h00       1.275       0.852       Jun01       0.025      -0.926
       10h30       0.984       0.910       Jun15      -0.004      -0.988
       11h00       0.675       0.953       Jul01      -0.039      -0.982
       11h30       0.355       0.980       Jul15      -0.065      -0.910
       12h00       0.029       0.990       Aug01      -0.067      -0.753
       12h30      -0.297       0.983       Aug15      -0.050      -0.570
       13h00      -0.619       0.959       Sep01       0.000      -0.343
       13h30      -0.930       0.919       Sep15       0.051      -0.132
       14h00      -1.225       0.863       Oct01       0.112       0.118
       14h30      -1.499       0.793       Oct15       0.154       0.333
       15h00      -1.747       0.708       Nov01       0.179       0.582
       15h30      -1.965       0.612       Nov15       0.169       0.760
       16h00      -2.150       0.505       Dec01       0.119       0.914
       16h30      -2.298       0.390       Dec15       0.055       0.985
       17h00      -2.407       0.267                  -0.040       0.978
       17h30      -2.475       0.141
       18h00      -2.500       0.012
       18h30      -2.482      -0.118
       19h00      -2.422      -0.245