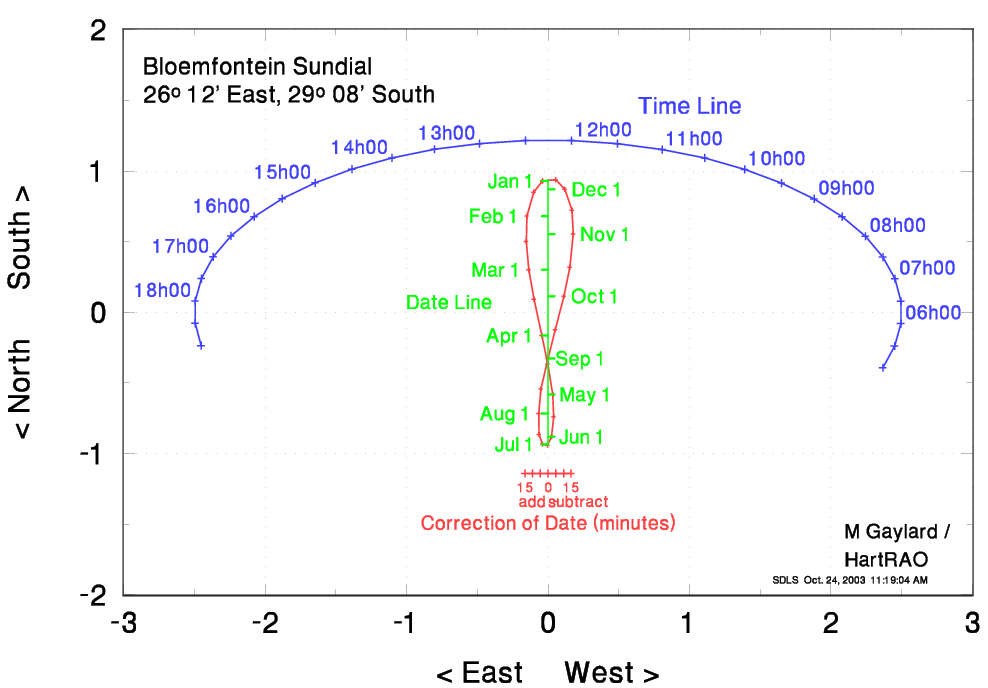

Note that the "squares" on the diagram must look square, ie one unit of length horizontally must equal one unit of length vertically.
The data used to create this sundial are listed below, if you want to make your own large "walk-on" sundial. The columns are:
	Bloemfontein sundial data

 Time       Xtime       Ytime        date         Xan         Yan        Teqn       XTeqn
05h00       2.367      -0.392       Jan01      -0.040       0.930      -15.00      -0.164
05h30       2.452      -0.238       Jan15      -0.101       0.849      -10.00      -0.109
06h00       2.495      -0.081       Feb01      -0.149       0.682       -5.00      -0.055
06h30       2.495       0.079       Feb15      -0.154       0.500        0.00       0.000
07h00       2.452       0.236       Mar01      -0.135       0.300        5.00       0.055
07h30       2.368       0.390       Mar15      -0.099       0.092       10.00       0.109
08h00       2.243       0.537       Apr01      -0.044      -0.164       15.00       0.164
08h30       2.080       0.675       Apr15      -0.001      -0.366
09h00       1.881       0.802       May01       0.033      -0.581
09h30       1.650       0.914       May15       0.040      -0.739
10h00       1.391       1.011       Jun01       0.025      -0.881
10h30       1.108       1.091       Jun15      -0.004      -0.939
11h00       0.806       1.152       Jul01      -0.039      -0.934
11h30       0.490       1.194       Jul15      -0.065      -0.866
12h00       0.166       1.214       Aug01      -0.067      -0.717
12h30      -0.161       1.215       Aug15      -0.050      -0.542
13h00      -0.486       1.194       Sep01       0.000      -0.326
13h30      -0.802       1.153       Sep15       0.051      -0.125
14h00      -1.104       1.092       Oct01       0.112       0.113
14h30      -1.387       1.013       Oct15       0.154       0.317
15h00      -1.647       0.916       Nov01       0.179       0.554
15h30      -1.878       0.803       Nov15       0.169       0.723
16h00      -2.077       0.677       Dec01       0.119       0.870
16h30      -2.241       0.539       Dec15       0.055       0.937
17h00      -2.367       0.392                  -0.040       0.930
17h30      -2.452       0.238
18h00      -2.495       0.081
18h30      -2.495      -0.079
19h00      -2.452      -0.236