HartRAO Home >
news >
NASSP and Rhodes University Students Radio Astronomy Practical 2004/09/03-9
NASSP and Rhodes University Students Radio Astronomy Practical 2004/09/03-9
Students of South Africa's National
Astrophysics and Space Science Programme arrived at HartRAO on 2004
September 3 to start their radio astronomy practical. A total of fifteen
NASSP students participated, and were joined by three Physics Hons students
from Rhodes University, making this the biggest RA practical held at HartRAO
(and making use of every available bed on site!)
Click on image for large version
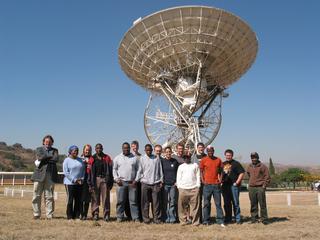
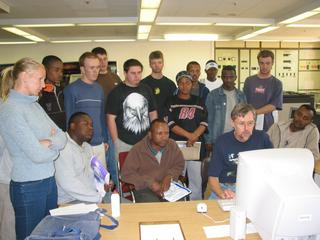
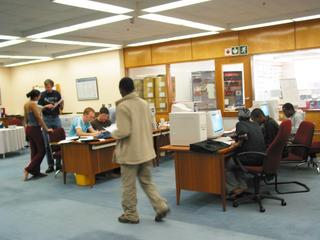
The combined group of NASSP and Rhodes students, with Director Justin Jonas
on the left.
Justin started the students off with measuring the noise
figure of a microwave receiver, of the type installed on the radio
telescope. This was followed by calibrating the receivers on the telescope
by means of drift scans through standard radio sources, and then deriving
the aperture efficency of the telescope in each receiver band.
Having calibrated the telescope, the students observed some objects with
"unknown" radio characteristics - the planets Jupiter and Venus, the
prototype quasar 3C273, and the well-known Orion Nebula.
On Monday Mike Gaylard introduced the students to spectroscopy at radio
frequencies. The photographs below capture some of the action.
Click on image for large version
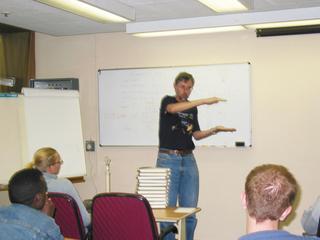
Mike started with a discussion of the types of spectra we can observe at
optical wavelengths, and asked the students to predict what we should see
from an incandescent lamp and from a fluorescent light.
Click on image for large version
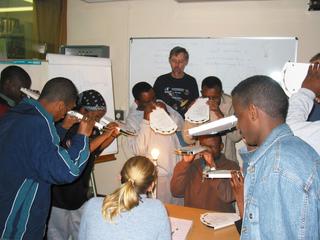
The students used Project STAR spectrometers to test their predictions, and
are seen here using them on an incandescent lamp.
Click on image for large version
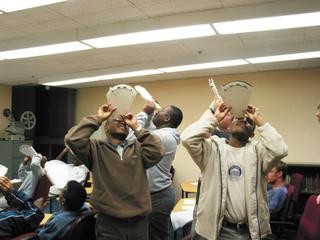
The overhead fluorescent lights were the next target.
Click on image for large version
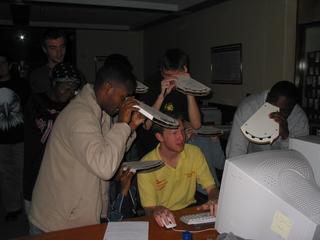
The next challenge was predicting the spectrum of light from PC screen
showing a predominantly white image. Rhodes University PhD student Adrian
Tiplady found his PC was the centre of attraction.
Click on image for large version
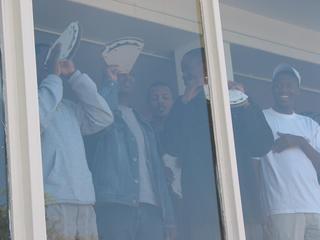
The last test was the spectrum of the Sun, observed by looking at the
sunlight scattered by the blue sky.
For most of the students, this was the first time that they had used a
spectrometer.
Click on image for large version
The students then moved on to radio spectroscopy, and as an example, the
spectrum of the radio emission from a gaseous nebula (HII region). These
produce both broadband continuum emission and line emission at discrete
frequencies from the ionised hydrogen gas. After an introduction to the
theory, the Orion nebula was used as a target for spectroscopy of a
recombination line from its ionised hydrogen. The brightness temperature of
the radio continuum emission at 5 GHz was measured by means of a drift scan
across the nebula, and the autocorrelation spectrometer was then used to
observe the H100alpha emission line. Here Mike shows how instrumental
effects are minimised by combining an on-source spectrum and an off-source
spectrum.
Click on image for large version
The students at work obtaining the temperature of the Orion nebula from
their data.
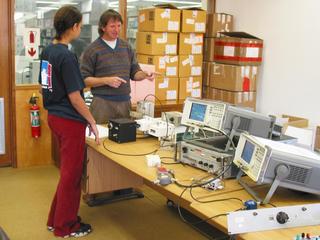
Click on image for large version
Justin explains how we measure the performance of a microwave amplifier.
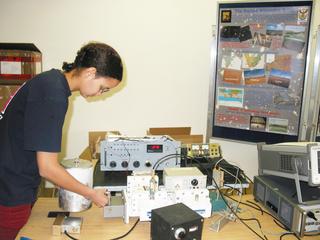
Click on image for large version
Getting down to the measurements - attaching the cold load, housed in a bath
of liquid nitrogen, to the input of the microwave amplifier.
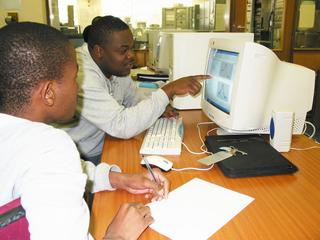
Click on image for large version
Students measuring the antenna temperature in left- and right-circular
polarization from a drift scan through a calibrator radio source, having
imported the data into a spreadsheet.
Click on image for large version
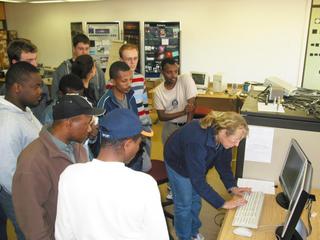
Sarah Buchner sets up an input file on the control computer for making a map
of the Sun.
Click on image for large version
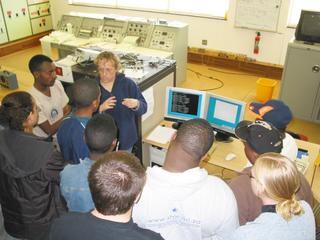
Sarah explains how to map the radio emission from the Sun by making a
raster map of scans across it.


